
-
Evie Huang sales consultant
-
Email: Sales@matictest.com
-
Phone/WhatsApp: +86 18996117830
Turbidity Measurement Explained: NTU, Scattering Geometry and Sensor Selection
Turbidity looks simple but hides real measurement subtleties. This guide covers what NTU means, why 90-degree infrared scattering is the standard geometry, how to choose a range, and what causes drift.
Turbidity is one of the most widely monitored water quality parameters and one of the easiest to get wrong. A turbidity reading depends not only on the water but on the optical geometry of the instrument, the wavelength used, and the condition of the optical window. This guide covers what turbidity actually means, how the measurement works, and how to select and maintain a sensor.
What Turbidity Measures
Turbidity is the cloudiness of a liquid caused by suspended particles. It is an optical property, not a direct measure of particle concentration — the same mass of particles can produce very different turbidity depending on size, shape, colour and refractive index.
This matters because turbidity is used as a surrogate for something else: the presence of suspended solids, the effectiveness of filtration, or the risk of microbial contamination. Understood that way, it is extremely useful; treated as an absolute measure of particle mass, it misleads.
Understanding NTU
NTU (Nephelometric Turbidity Unit) is the standard unit for turbidity measured by nephelometry — that is, by measuring scattered light. The original calibration standard was formazin, a polymer suspension with reproducible optical properties.
- NTU — nephelometric turbidity units, based on scattered-light measurement at 90°.
- FTU — formazin turbidity units, essentially equivalent when formazin is the calibration standard.
- FTU vs NTU — for practical purposes the values are comparable; NTU implies the nephelometric method.
Measurement Geometry: Why 90 Degrees
When a light beam passes through water containing particles, the light is scattered in all directions. The intensity and angular distribution of that scattered light depends on particle size.
| Geometry | Principle | Typical use |
|---|---|---|
| 90° scattered light (nephelometric) | Detector at right angles to the beam | Low turbidity — drinking water, standard compliance method |
| Transmitted light (absorbance) | Measures light remaining after passing through | High turbidity ranges |
| Backscatter (e.g. 180° or 135°) | Detector near the source side | Compact probes, high-turbidity and in-situ applications |
| Ratio / multi-angle | Combines several detectors | Compensates for particle size and window fouling |
The 90° geometry is the reference method for drinking water because it is most sensitive at low turbidity, where the regulatory interest lies.
Why Infrared Rather Than White Light
Turbidity sensors may use visible (often white or near-IR LED) or infrared sources. Infrared offers a specific advantage: it is far less affected by the colour of the sample.
In coloured water — humic-rich surface water, dye-laden textile effluent — a visible-light sensor can under- or over-read because the dissolved colour absorbs part of the light. An infrared source largely avoids this interference, which is why 90° infrared scattering is widely specified for natural water and wastewater.
Choosing a Measurement Range
Range selection is the most consequential specification decision, because a sensor optimised for high turbidity will lack resolution where drinking water matters, and vice versa.
| Application | Typical turbidity | Recommended range |
|---|---|---|
| Treated drinking water | < 0.1–1 NTU | 0–400 NTU (high resolution at low end) |
| Secondary supply, pool water | 0.5–5 NTU | 0–400 NTU |
| Surface water, rivers | 1–100 NTU | 0–400 NTU |
| Municipal wastewater influent | 100–1000+ NTU | 0–4000 NTU |
| Industrial effluent, stormwater | Up to several thousand NTU | 0–4000 NTU |
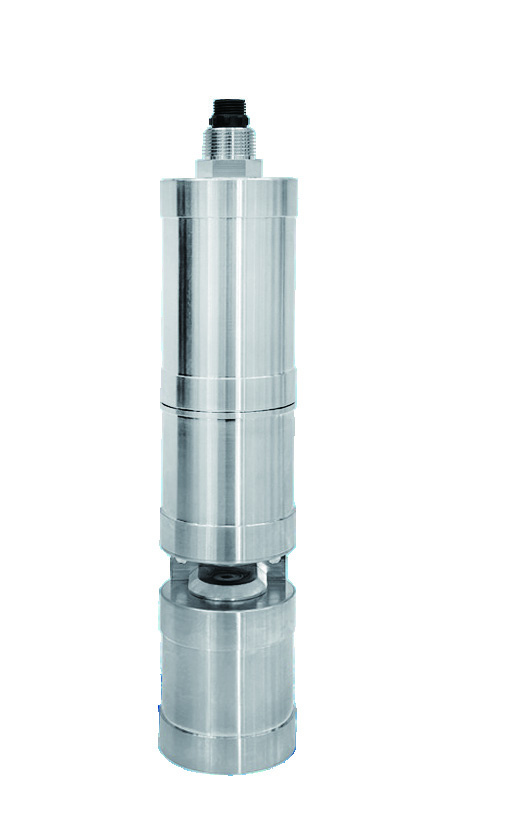
Sensors such as the MT-380 series are offered in both 0–400 NTU and 0–4000 NTU variants specifically so that the range can be matched to the duty rather than compromised.
What Causes Turbidity Readings to Drift
- Optical window fouling: The dominant cause. Biofilm, scale or oil on the window scatters additional light and pushes the reading upward.
- Bubbles: Air bubbles on the optical surface produce large spurious spikes, especially in aerated basins.
- Ambient light ingress: Sunlight reaching the detector corrupts the measurement — important in open channels.
- Stray light from reflections: Shiny tank walls or fittings near the optical path.
- Particle characteristics changing: Because turbidity is optical, a change in particle type changes the reading even if mass concentration is constant.
- Colour interference: Significant with visible-light sources in coloured water.
Installation and Maintenance Practice
- Mount the sensor where water flows steadily across the optical window — stagnant zones foul faster.
- Position the optics away from aerator outlets to avoid bubble interference.
- Shield from direct sunlight, or use a flow cell, for open-channel installations.
- Provide access for cleaning without dismantling pipework.
- Set a cleaning schedule from observed fouling rate rather than a fixed calendar interval.
- Verify against a laboratory or handheld reference periodically, and log the comparison.
Automatic Cleaning: Worth It?
In fouling-prone applications, an automatic cleaning mechanism (wiper, air blast or brush) converts a high-maintenance sensor into a low-maintenance one. The economics are straightforward: compare the cost of the cleaning option against the labour cost of the visits it eliminates over the sensor’s life. In remote or submerged sites the cleaning option almost always wins.
Turbidity as a Compliance and Safety Parameter
Turbidity earns its place in drinking water monitoring not because particles are inherently toxic but because they interfere with disinfection and can shield microorganisms from it. A turbidity spike after filtration is therefore treated as a potential safety signal, not merely a quality one — which is why continuous monitoring with alarms, rather than periodic sampling, is standard practice.
Conclusion
Reliable turbidity measurement comes from matching three things to the application: the optical geometry (90° nephelometric for low-turbidity compliance work), the light source (infrared where colour varies), and the range (as low as the application allows without clipping peaks). Add a cleaning regime derived from observed fouling, and turbidity becomes one of the most dependable indicators in the whole monitoring system.
Frequently Asked Questions
What is the difference between turbidity and suspended solids?
Suspended solids (TSS) is a gravimetric measurement of the mass of particles retained on a filter. Turbidity is an optical measurement of how those particles scatter light. They correlate within a given water type but the relationship changes with particle size, shape and colour, so turbidity cannot replace TSS without site-specific calibration.
Why does my turbidity reading creep upward over weeks?
Progressive upward drift with no change in the process almost always indicates fouling of the optical window. Clean the window, verify against a reference, and shorten the cleaning interval if the drift returns quickly.
Can I use one sensor for both drinking water and wastewater?
Generally no, not optimally. Drinking water needs high resolution below 1 NTU, while wastewater influent may exceed 1000 NTU. Select the range for the duty — 0–400 NTU for clean water, 0–4000 NTU for wastewater.
Do bubbles really matter?
Yes, and they produce a characteristic signature: sharp, random spikes rather than a smooth trend. Relocating the sensor away from aeration or turbulence usually resolves it.
Is infrared always better?
Infrared is better where sample colour varies, because it is less affected by dissolved colour. For highly standardised low-turbidity compliance measurements, the reference methods are defined in their own terms, so follow the applicable standard rather than assuming infrared is universally superior.

About Author

Hello, I'm Leno Zhang. I have 15 years of experience in the water quality monitoring industry, with extensive pre-sales and after-sales project experience. Our company specializes in integrated water quality monitoring stations, multi-parameter analyzers and smart sensors. I can assist customers in solving all practical on-site project challenges and provide the most suitable integrated solutions.
Tell Us Your Requirement
High Quality
Stable performance, IP-rated field design, accurate measurement and reliable data for 24/7 water quality monitoring in harsh environments.
Fast Delivery
Timely delivery to support your urgent orders and project schedules efficiently and professionally at any time.
Best Warranty
Professional Warranty: 12-month coverage plus long-term remote support for stable water quality monitoring and customer satisfaction.