
-
Evie Huang sales consultant
-
Email: Sales@matictest.com
-
Phone/WhatsApp: +86 18996117830
How to Build a River Water Quality Monitoring Station: Site Selection, Parameters and Compliance
A practical framework for planning a river monitoring station — where to site it, which parameters to measure, how to handle power and communications, and what determines whether the data is defensible.
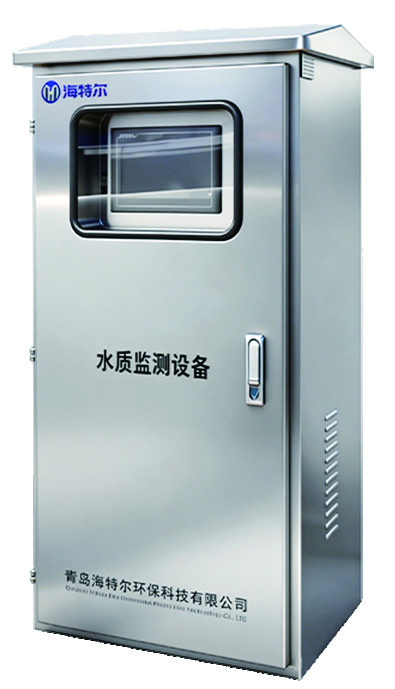
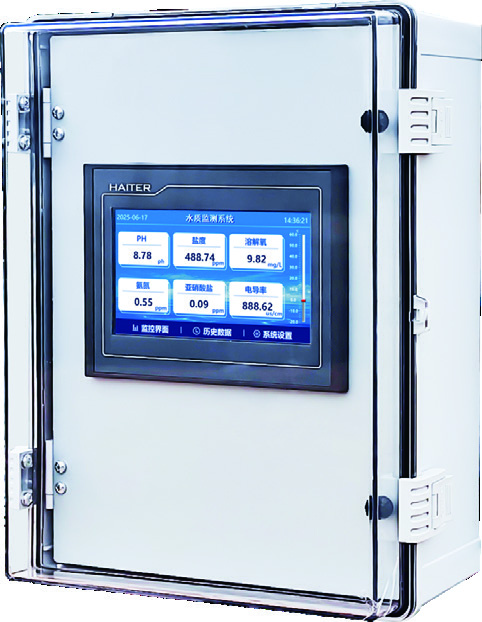
A river water quality monitoring station is a long-term asset. Decisions made during planning — where the station sits, which parameters it measures, how it is powered — determine whether it produces defensible data for a decade or becomes an expensive maintenance liability. This guide walks through the decisions in the order you need to make them.
Start With the Question, Not the Equipment
Before specifying instruments, define what the station must answer. Different objectives lead to genuinely different designs:
| Objective | Implication for design |
|---|---|
| Regulatory compliance at a boundary | Parameters fixed by the consent; data integrity and audit trail are critical |
| Early warning of pollution events | Rapid response parameters, high sampling frequency, robust alarming |
| Long-term trend assessment | Emphasis on stability, calibration discipline and consistent methodology |
| Catchment or source tracking | Multiple sites rather than more parameters at one site |
Site Selection
Siting is the single decision that most affects data quality, and it is the hardest to change later.
Hydraulic Representativeness
The station should sample water that represents the cross-section, not a stagnant backwater. Look for:
- A straight, well-mixed reach — ideally downstream of a natural riffle or confluence that promotes mixing.
- Avoidance of dead zones, eddies and backwaters where water is not exchanged with the main flow.
- Reasonable and stable flow depth across seasons, including at low flow.
- Access for installation and, importantly, for routine maintenance visits.
Practical and Security Considerations
- Access and safety: Can a technician reach the site safely, in the dark, in bad weather?
- Flood risk: Check historical high-water marks and site the cabinet above them.
- Vandalism and theft: Favour visible, lit locations or provide enclosures and alarms.
- Power availability: Mains supply dramatically simplifies design; without it, solar and battery sizing become central.
- Mobile coverage: Verify actual signal strength at the site before committing to a cellular telemetry design.
Parameter Selection
Parameters fall into tiers. Start with the core set and add only where there is a defined reason.
Core Physicochemical Set
- pH — fundamental, tight regulatory limits, sensitive to industrial discharge and acidification.
- Dissolved oxygen — the primary indicator of aquatic ecosystem health; collapses under organic pollution.
- Conductivity — cheap, robust, and an excellent tracer for saline intrusion and industrial effluent.
- Turbidity — responds quickly to runoff events and is a useful surrogate for suspended solids.
- Temperature — needed to interpret almost every other parameter.
Nutrient Set
- Ammonia nitrogen (NH₃-N) — toxic to aquatic life and a direct indicator of sewage or agricultural input.
- Total nitrogen and total phosphorus — the drivers of eutrophication, usually required for catchment assessment.
- Nitrate and nitrite — agricultural runoff tracers, and relevant to drinking water abstraction.
Organic Pollution Set
- COD or TOC — total organic load; TOC and optical surrogates avoid reagent handling.
- BOD — regulatory staple, but rarely measured online; usually estimated from a correlated parameter.
Supplementary Parameters
Chlorophyll and blue-green algae for eutrophication and bloom monitoring; flow or level for load calculation; specific ions where a known industrial discharge is present.
Measurement Approach: Wet Chemistry versus Optical
| Aspect | Wet-chemistry analyser | Reagent-free optical sensor |
|---|---|---|
| Reagent consumption | Ongoing cost and handling | None |
| Chemical waste | Produced, requires disposal | None |
| Maintenance visits | Frequent | Infrequent |
| Parameters per instrument | Typically one or two | Many from one probe |
| Regulatory acceptance | Well established | Verify acceptance locally |
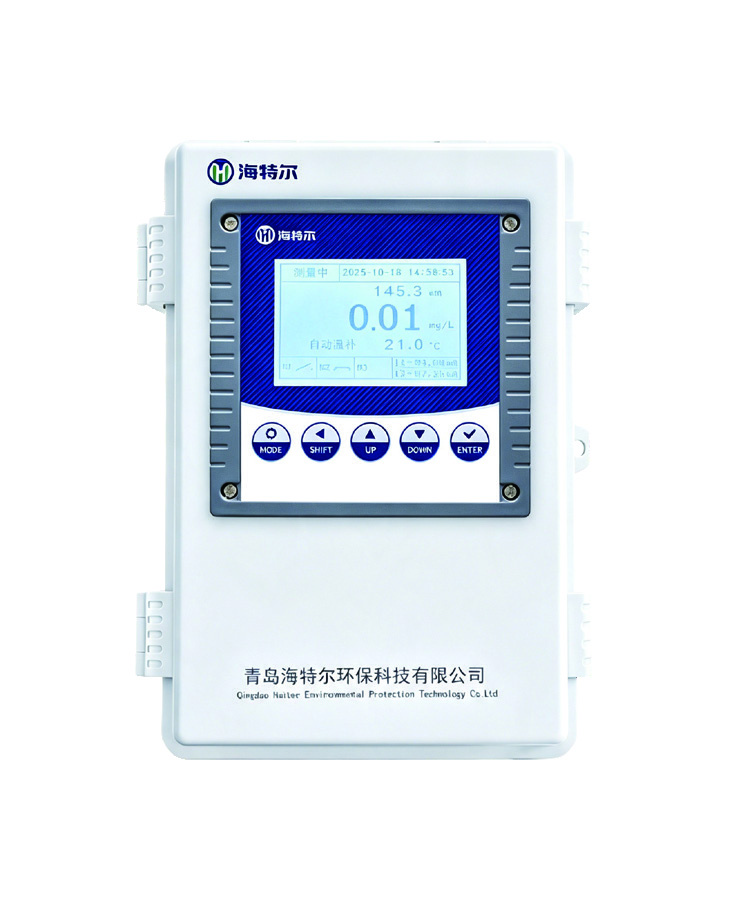
For remote sites, reagent-free measurement is usually decisive: it removes the two largest ongoing costs, reagent logistics and the associated maintenance travel. A full-spectrum UV-Vis sensor such as the MT-GP-808 reports COD, BOD, TOC, turbidity, colour, TP, TN, NH₃-N, nitrate and nitrite from a single probe, with automatic turbidity compensation.
Power and Communications
Power
- Mains: Simplest where available; include surge protection and battery backup for continuity.
- Solar: Size the panel and battery against the worst month, not the annual average. Account for sensor power, telemetry transmission peaks and heating or cooling loads.
- Power budget: Telemetry transmission is usually the largest consumer — reporting interval is the main lever.
Communications
- 4G/5G cellular: The default choice; verify coverage and plan for data volume.
- Fibre: Where available at fixed installations, offers the highest reliability.
- LoRa or radio: Appropriate for short-range links to a gateway.
- Satellite: Justified only where terrestrial coverage is genuinely unavailable.
An ultra-low-power telemetry terminal such as the MT-GL001 combines data collection, 4G transmission and battery management in an IP68, 316 stainless steel housing, with 3–5 years battery life on the lithium option — which removes the power constraint at most sites.
Data Quality: What Makes Data Defensible
- Documented calibration: Every calibration recorded with date, buffers or standards used, and result.
- Audit trail: Any change to configuration or thresholds logged with who made it and when.
- Flag maintenance periods: Data collected during servicing must be marked, not silently included.
- Periodic verification: Compare online readings against laboratory analysis on split samples.
- Range and drift checks: Automatic detection of out-of-range and frozen values.
- Data completeness target: Define and monitor the required capture rate.
Typical Specification for a River Station
| Element | Typical specification |
|---|---|
| Core parameters | pH, dissolved oxygen, conductivity, turbidity, temperature |
| Extended parameters | Ammonia nitrogen, total nitrogen, total phosphorus, COD or TOC |
| Reporting interval | 15–60 minutes for core parameters; event-triggered for alarms |
| Power | Mains with battery backup, or solar with lithium battery |
| Communications | 4G telemetry with local data buffering |
| Enclosure protection | Cabinet IP65 or better; sensors IP68 |
| Data capture target | Commonly 90% or higher |
Conclusion
A river monitoring station succeeds or fails on decisions made before any equipment is ordered. Get the siting right, match the parameter set to the actual question, choose a measurement approach whose maintenance burden you can genuinely sustain, and build data quality procedures in from the start. Do that, and the station delivers trustworthy data for years rather than becoming a maintenance problem with a data feed attached.
Frequently Asked Questions
How much does a river monitoring station cost?
It varies widely with parameter set, power and communications. The more useful question is total cost of ownership: reagent-free sensors and long-life battery telemetry typically cost more upfront but substantially less over five years, especially at remote sites where every visit is expensive.
How often should data be reported?
15 to 60 minutes suits most river monitoring. Faster reporting mainly matters for pollution event detection; slower may suffice for long-term trend assessment. Remember that reporting frequency drives both power consumption and data volume.
Can one station cover a whole catchment?
Rarely. Catchment understanding usually comes from several simpler stations at tributary confluences and boundaries, rather than one elaborate station in one place. More sites generally beats more parameters.
What is the most common cause of bad station data?
Sensor fouling, followed by calibration drift that went unnoticed. Both are addressed by a realistic cleaning interval and a verification schedule against laboratory results — not by buying more accurate instruments.
Do I need flow measurement as well?
If you need pollutant load rather than concentration, yes. Concentration tells you how dirty the water is; flow lets you calculate how much pollutant is passing, which is what catchment accounting and many regulatory frameworks require.
About Author

Hello, I'm Leno Zhang. I have 15 years of experience in the water quality monitoring industry, with extensive pre-sales and after-sales project experience. Our company specializes in integrated water quality monitoring stations, multi-parameter analyzers and smart sensors. I can assist customers in solving all practical on-site project challenges and provide the most suitable integrated solutions.
Tell Us Your Requirement
High Quality
Stable performance, IP-rated field design, accurate measurement and reliable data for 24/7 water quality monitoring in harsh environments.
Fast Delivery
Timely delivery to support your urgent orders and project schedules efficiently and professionally at any time.
Best Warranty
Professional Warranty: 12-month coverage plus long-term remote support for stable water quality monitoring and customer satisfaction.